-
Determining the Price for One When All You Have Is the Price for Many
It’s rare for all patents included in portfolio license or sale agreements to have equal value. When only a small subset of patents are at issue, how can we estimate their worth?
Patent infringement litigation often requires determining the value of an individual patent or a small subset of patents that have been bundled together with dozens, or even hundreds, of other patents in a portfolio license or sale agreement. While the price paid for the entire portfolio may be known, how much of that price is attributable to individual patents in the portfolio is not.
The value of any individual patent, or of a subset of patents, rarely, if ever, can be calculated simply by dividing the price paid for the portfolio by the number of patents included in the agreement. The value of each patent in a portfolio is based on its unique characteristics, such as its technical advantages over other technologies, the marketplace demand for these advantages, the relative contribution of the patent to the overall product, and the patent’s legal strength, among other things.
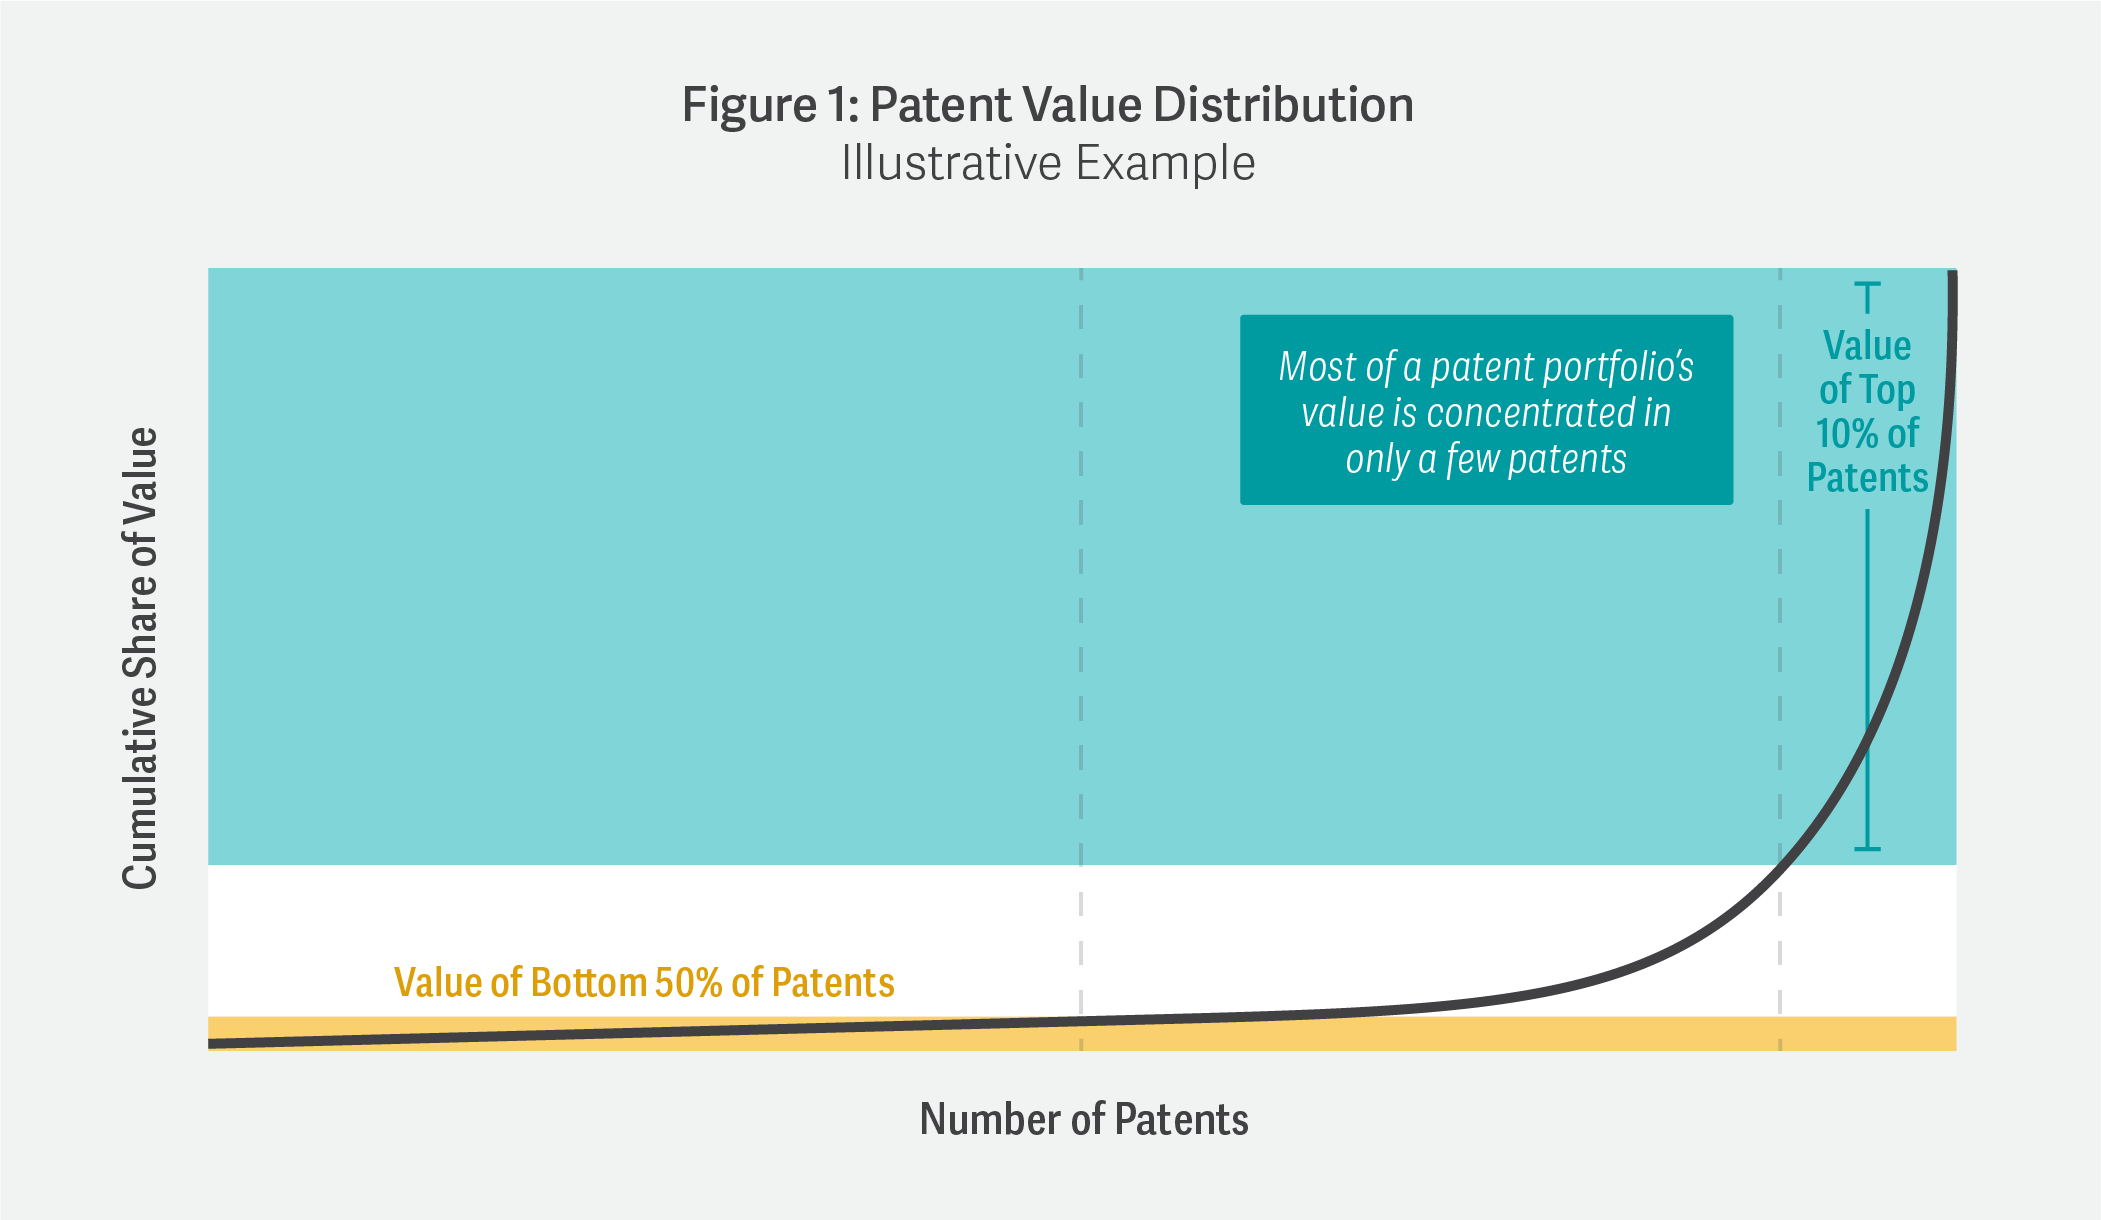
Because these characteristics can vary widely, it is no surprise that patent values can also vary across the portfolio. As illustrated in Figure 1, we know from well-established research that the distributions of patent values across a portfolio are highly skewed. Some patents may be worth a lot, but most are worth very little.

While we know that a disproportionate share of a portfolio’s value is concentrated in relatively few patents, knowing how much of the total price paid for the portfolio to apportion to specific patents is the question. How, then, may we determine the price for any of the component patents when all we have is the price for the entire portfolio?
Using Research on Patent Value Distributions to Determine Individual Patent Values
One method that may be used to answer this question relies upon academic research regarding the distribution of patent values for different groups of patents spanning different time periods, geographies, and technologies. This research utilizes several methodologies, including patent renewals, forward citations, stock price movements, surveys, and licensing. (See Table 1.)
Table 1: Patent Value Distribution Research
Methodology Description Studies reviewed Patent renewals Patent renewal fees can provide relevant information about patents’ minimum value (when patents are renewed) or maximum value (when patents are not renewed) Pakes (1986)
Schankerman (1998)
Barney (2002)
Deng (2011)Forward citations Forward citations measure the technical or scientific value of patents Vigil, et al. (2020) Stock price movements Stock price movements measure the expected value of the patents (i.e., the present discounted value of expected profits) at the time the patents are issued Kogan, et al. (2017) Surveys Surveys measure respondents’ belief about the smallest amount that they would have been willing to sell each patent for, had they possessed full knowledge of the profit potential of the patent Scherer and Harhoff (2000) Licensing Licensing royalties reflect the value received by the patent owners from licensing over a specified time period Scherer and Harhoff (2000) Though the data and methodology used in these studies are different, their results generally corroborate the conclusion that a patent portfolio’s value typically is concentrated in only a small percentage of patents. (See Table 2.)
Table 2: Study Results for Proportion of Value in Top 10% of DistributionPatent renewals Forward citations Stock price movements Surveys Licensing All industries US 70% France 69% Germany 47% UK 56% US 81–85% Germany 84% US 84–93% Chemicals France 61% US 45% US 60% Electronics France 80–86% Europe 86% US 42% US 60% Mechanics France 76% US 35% US 52% Pharmaceuticals France 55% Europe 85% US 45% US 57% Note: Values are rounded
While the degree of disproportionality of patent values indicated by these studies varies, the differences reflect, in part, the fact that each methodology is measuring different things or looking at value in different ways.
Making the Most of the Information Available for Patent Valuation
We have found that the results from these studies may be generalizable to a broader set of facts and circumstances than those underlying the individual studies. Among other things, findings from this research show that patent value distributions:
- are not materially different for different subsets of a broader category of technology;
- have been relatively stable over time for a given technology; and
- may not be materially different across countries for a given technology.
Our research suggests that, in certain circumstances, the results from these patent value distribution studies can be combined with information about the unique characteristics of the patent being valued to determine what proportion of the total portfolio price may be attributable to the patent of interest. How relevant the results from a given study are will depend upon the facts and circumstances of the case and how the patent value distributions will be used.
The methodologies for the individual studies discussed here are rooted in rigorous economic research and have been accepted by the courts. Depending upon the facts of the case, they may provide a reliable framework for determining the value of individual patents that are part of a larger portfolio when all you have is the price for the entire portfolio. As a result, these methodologies make it possible to utilize potentially relevant information from these portfolio license and sale agreements that often went unused in the past. ■
-
Robert Vigil, Principal
Xiao Zhang, Associate
Source
“Apportioning Value In Patent Portfolio License And Sale Agreements,” published in the Licensing Executives Society International journal les Nouvelles
From Forum 2022.
